For large-scale PV systems, it is often necessary to control the power flow at the Point of Delivery (POD) to meet certain interconnection requirements. This may impact the energy delivered to the grid and is therefore desirable to simulate within the performance model. There are two plant control modes which may be simulated during performance modeling: Real Power Control Only and Real and Reactive Power Control. The two modes are discussed here:
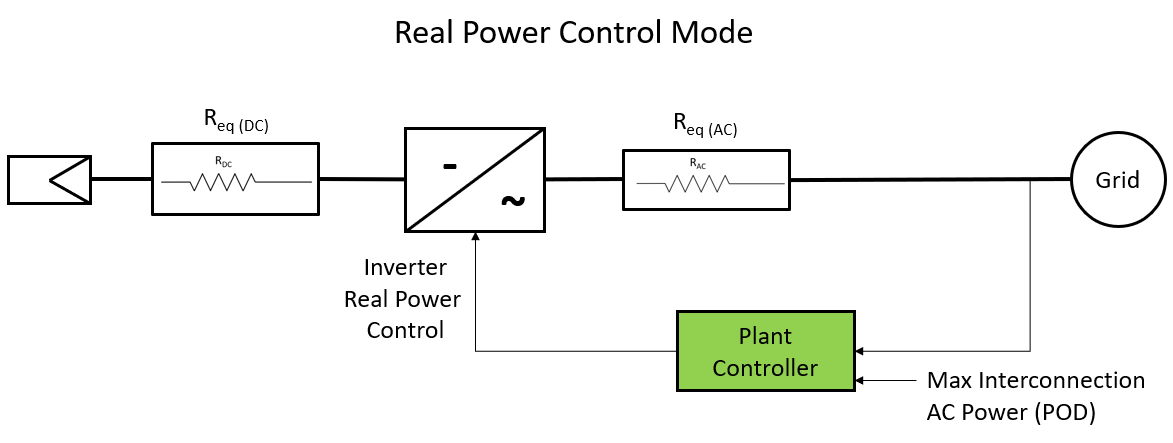
Real Power Control Only Mode
When this mode of plant control is selected, only real power flow and corresponding losses within the plant are considered. Power Factor and the losses associated with reactive power compensation are not considered and any inputs associated with Power Factor are ignored in the simulation. To model the AC losses between the inverter terminals and grid, only the resistive component of AC cable and transformer impedance is considered. For each hour time step of the simulation, the Plant Controller measures the available power at the point of delivery. If the available power exceeds the Max Interconnection AC Power (at POD) as defined by the user, the Plant Controller curtails the generation so that the power delivered to the grid at the point of delivery equals the Max Interconnection AC Power limit defined by the user. Any power curtailed through this process is listed in the losses report under the Generation Curtailment category.
It is important to recognize that Energy Availability losses are applied uniformly to each hour of the simulation and this occurs after Generation Curtailment losses are removed.
To view the actual maximum power delivered to the grid, refer to the Maximum Power Delivered to Point of Delivery line item within the Energy Performance Summary. This power value does not include Energy Availability losses.
Similarly, to view the maximum available power that could be delivered to the grid, refer to the Maximum Power Available at Point of Delivery line item within the Energy Performance Summary. This power value does not include Energy Availability or Generation Curtailment losses.
Finally, to view the power consumed by the plant at nighttime, refer to the Nighttime Power Consumption line item within the Energy Performance Summary. This includes inverter nighttime consumption losses, transformer no-load losses and station losses.
The following is a simple illustration of the Plant Control scheme under Real Power Control Mode:
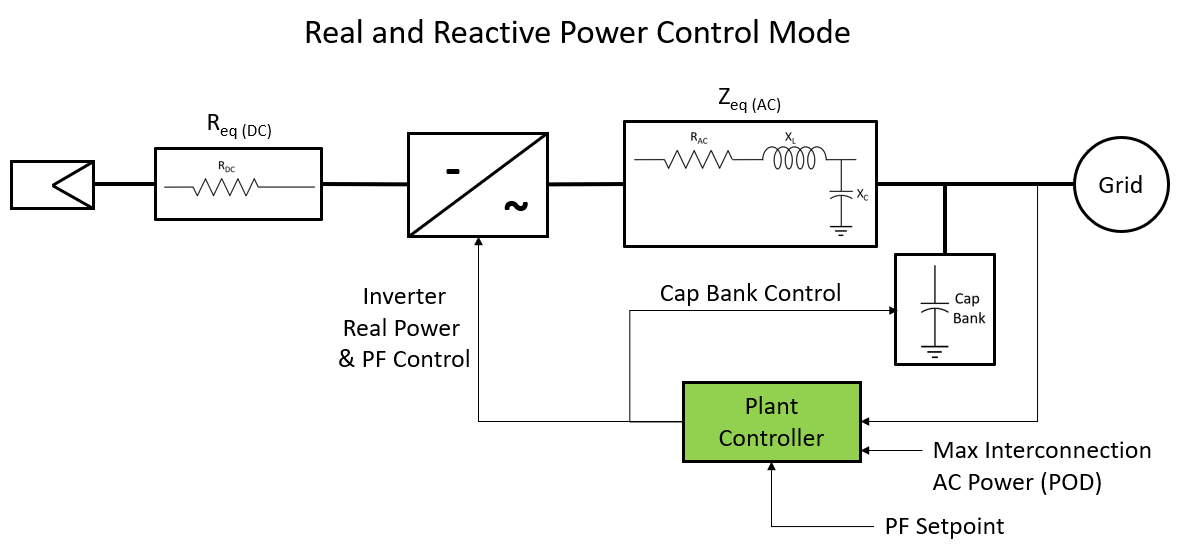
Real and Reactive Power Control Mode
When this mode of plant control is selected, both real and reactive power flows and corresponding losses within the plant are considered. To model the AC losses between the inverter terminals and grid, the resistive and reactive components of AC cable and transformer impedances are considered. For each hour time step of the simulation, the Plant Controller measures the available power and power factor at the point of delivery. The plant controller switches in and out capacitor bank stages (if included in the design) and adjusts the inverter power factor within the limits specified in the inverter profile to achieve the Average Operating Power Factor at the Point of Delivery. If the available power exceeds the Max Interconnection AC Power (at POD) as defined by the user, the Plant Controller also curtails the generation so that the power delivered to the grid at the point of delivery equals the Max Interconnection AC Power limit defined by the user. If this occurs, it re-evaluates the power factor and re-adjusts the inverter power factor (if necessary). Any real power lost through reactive power compensation is listed in the losses report under the Reactive Power Compensation category. Any real power curtailed to not exceed the Max Interconnection AC Power Limit is listed in the losses report under the Generation Curtailment category.
It is important to recognize that Energy Availability losses are applied uniformly to each hour of the simulation and this occurs after Generation Curtailment losses are removed.
To view the actual maximum power delivered to the grid, refer to the Maximum Power Delivered to Point of Delivery line item within the Energy Performance Summary. This power value does not include Energy Availability losses.
Similarly, to view the maximum available power that could be delivered to the grid, refer to the Maximum Power Available at Point of Delivery line item within the Energy Performance Summary. This power value does not include Energy Availability or Generation Curtailment losses.
To view the power consumed by the plant at nighttime, refer to the Nighttime Power Consumption line item within the Energy Performance Summary. This includes inverter nighttime consumption losses, transformer no-load losses and station losses.
Finally, to view the reactive power exported by the plant at nighttime, refer to the Nighttime Reactive Power Export line item within the Energy Performance Summary. This includes reactive power generated due to cable capacitance.
The following is a simple illustration of the Plant Control scheme under Real and Reactive Power Control Mode:
Plant Controller Algorithm
The following is performed for each hour of the power flow simulation:
- Real and reactive power flow and power factor are computed at the point of delivery.
- The plant controller chooses how many cap bank stages to switch in to get as close as possible to the Average Operating Power Factor specified by the user.
- Real and reactive power flow and power factor are re-computed at the point of delivery.
- The plant controller computes the power factor to operate the inverters at (within the power factor range specified in the inverter profile) to achieve the Average Operating Power Factor specified by the user. If the Average Operating Power Factor cannot be achieved for a given hour (which is often the case for low generation levels), the plant is operated as closely as possible to the Average Operating Power Factor specified by the user.
- Real and reactive power flow and power factor are re-computed at the point of delivery.
- If the real power level exceeds the Max Interconnection AC Power specified by the user, then the plant controller curtails the real power level of the inverters to not exceed the Max Interconnection AC Power.
- If the real power of the inverter was reduced in Step 6, the power factor of the inverter is re-adjusted (within the power factor range specified in the inverter profile) to maintain the Average Operating Power Factor specified by the user.
- Real and reactive power flow and power factor are re-computed at the point of delivery.