Step 1: Within the Project Design Environment, Click Financial on the left Navigation Bar.
Step 2: If you would like to load a Financial Profile into the project, select the desired Financial Profile from the drop-down menus and click Load Profile.
Note: You have the option of loading a User Defined Financial Profile or an HST Regional Financial Profile. To load a User Defined Financial Profile, one must first be created within Your Account. See Create and Edit Financial Profiles. Alternatively, HST maintains a database of reasonable default financial parameters by country and US state. Once a Financial Profile is loaded into the project, the financial parameters may be edited to fit your project. All edits will be highlighted in red font once the project is saved to show which parameters have been changed from the database values.
Step 3: Enter Power Purchase Agreement (PPA) and Merchant Power Pricing Information.
| Field | Description | Default | Range |
| PPA Price Year 1 ($/kWh) | Power Purchase Agreement (PPA) price paid for energy generated in year 1. Note this price may be modified through Time of Delivery Factors. | 0.05 | [0.01 – 0.50] |
| PPA Lifespan | Total number of years in which the Power Purchase Agreement is in effect. Note if the Project Lifespan exceeds the PPA Lifespan, the Merchant Power Pricing specified will be used for years after the expiration of the PPA. | 25 | [5 – 40] |
| PPA Escalation Factor (%/year) | Annual escalation rate applied to the PPA price for the number of years specified in PPA Escalation Years. | 1 | [0 – 10] |
| PPA Escalation Years (years) | The number of years within the PPA Lifespan in which the PPA Escalation Factor will be applied. | 20 | [0 – 25] |
| Project Lifespan (years) | Project lifespan is the total number of years in which the power plant will be in commercial operation. | 25 | [5 – 40] |
| Time of Delivery Factors | Time of Delivery Factors allow hourly and monthly price multipliers to be applied to the price paid for energy generated. Note the TOD multiplier will be applied to energy generated in that hour. For example, a TOD multiplier specified by the user at 1pm will be applied to energy generated between 1:00pm and 1:59pm. | See Time of Delivery Section Below | |
| Merchant Power Price | Use Merchant Power Prices to specify the price paid for energy generation after the expiration of the Power Purchase Agreement (PPA). Note that TOD factors will continue to be applied to the Merchant Power Pricing specified. | See Merchant Power Pricing Section Below |
Time of Delivery Factors
To specify the purchase price paid by a utility for energy generated in a given month at a given time, PPA Price Multipliers may specified and applied to the 12 month by 24 hour schedule. Up to nine unique PPA Price Multipliers may be specified. The period number for these multipliers may then be inserted into the 12 month by 24 hour schedule. The color of the PPA Price Multiplier corresponding with the Period is highlighted in the schedule. The Time of Delivery Factors specified are applied to all years of the Project Lifespan and therefore do not end at the expiration of the PPA.
In any given year n, the price paid for energy generated will be calculated as follows:
If n <= PPA Escalation Years:
Price = ((PPA Price year 1) * (1 + PPA Escalation Factor/100)^(n – 1)) * (PPA Price Multiplier)
If PPA Escalation Years <= n <= PPA Lifespan:
Price = ((PPA Price year 1) * (1 + PPA Escalation Factor/100)^(PPA Escalation Years – 1)) * (PPA Price Multiplier)
If n >= PPA Lifespan:
Price = ((Merchant Power Price Year (n – PPA Lifespan)) * (PPA Price Multiplier)
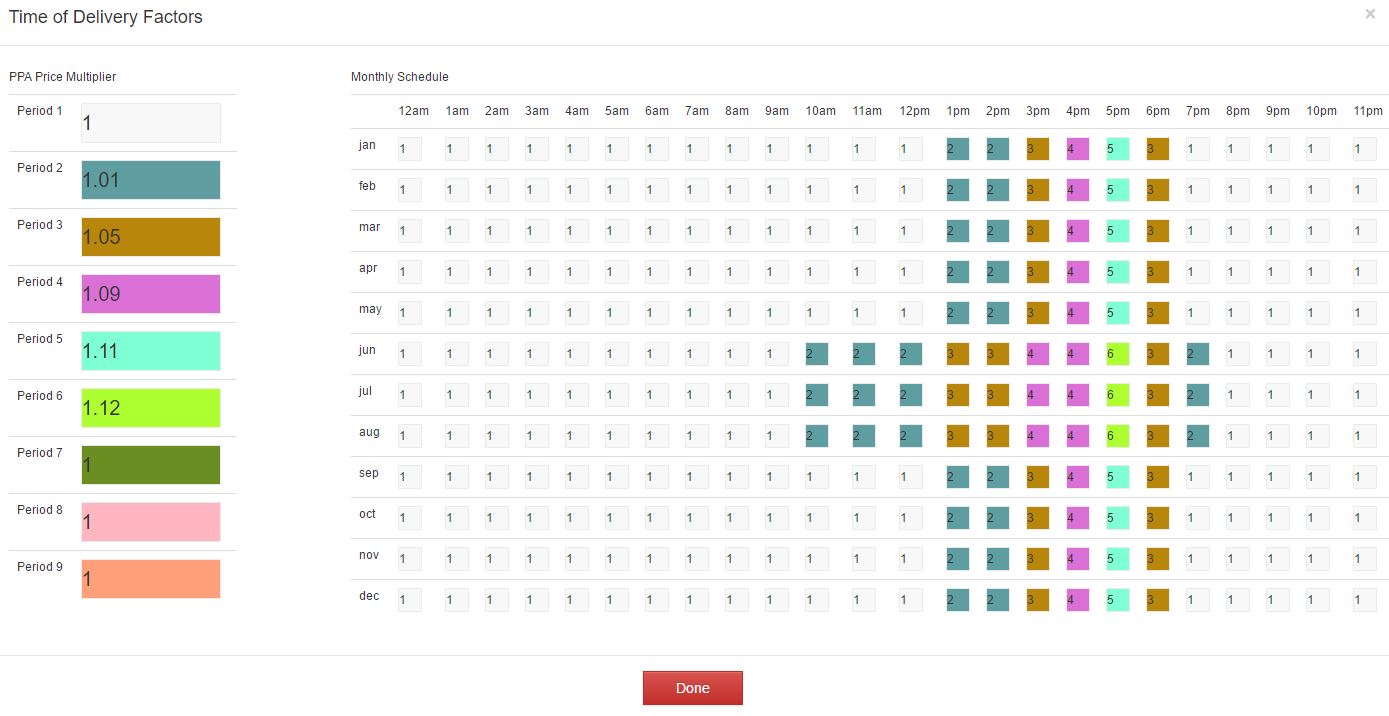
In the example screenshot above, energy generated between 5:00pm and 5:59pm during the month of May would receive an addition 11% (1.11 multiple) of revenue over the Year 1 PPA Price escalated per the PPA Escalation Factor. For example, if the PPA Price in Year 1 is $0.05/kwh, the escalation factor is 1%, the escalation years are 20 and PPA Lifespan is 20, the price paid for energy generated between 5:00pm and 5:59pm during the month of May in Year 1,2 and 3 would be as follows:
Year 1: $0.0555/kWh
Year 2: $0.05605/kWh
Year 3: $0.05662/kWh
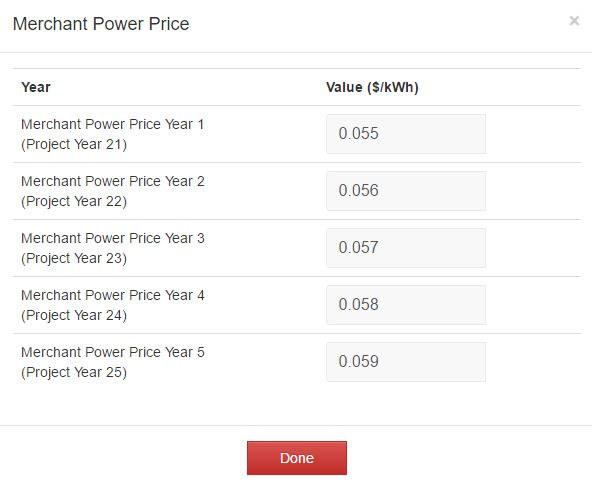
Merchant Power Pricing
Merchant Power Prices may be specified for each year that the Project Lifespan exceeds the PPA Lifespan. The user interface is dynamic and the number of fields will adjust based on the difference between Project Lifespan and PPA Lifespan. The pricing specified in these fields is applied to the appropriate project year. Note that Time of Delivery Factors will continue to be applied during the Merchant Power phase of the project. However, the PPA Escalation Factor will no longer apply since this may only extend through the length of the PPA Lifespan.
In the below example screenshot, the Project Lifespan was 25 years and PPA Lifespan was 20 years. The user has also manually increase the Merchant Power Prices for each year:
Step 4: Enter Financial Market Data.
| Field | Description | Default | Range |
| Insurance Rate (%) | Insurance is a yearly operating expense. It is computed as a percent of the total project installed cost. The insurance rate specifies the percent in year one | 0.5 | [0 – 5] |
| Insurance Escalation Rate (%/year) | The insurance rate is compounded yearly by the insurance rate escalation. This escalation is absolute, so escalation due to inflation must be added to this value | -6 | [-10 – 10] |
| Inflation Rate (%) | Annual inflation rate | 2.5 | [-10 – 10] |
| Salvage Percentage (%) | Percent of the total installed cost that is recovered at the of the project. It is treated as a single revenue cash flow in the final year of the project | 0 | [0 – 20] |
| Real Discount Rate (%) | – | 8.2 | [-10 – 20] |
Step 5: Enter Development Costs.
| Field | Description | Default | Range |
| Is Land Owned or Leased? | Is Land Owned or Leased? | Lease | [Own, Lease] |
| Site Preparation Costs ($/acre) | Land and Site Prep Costs. | 200 | [10 – 10000] |
| Interconnection Gen-Tie Costs ($/kWac) | Substation, Gen-Tie and Interconnection Upgrade Costs | 30 | [0 – 500] |
| Land Purchase Cost ($) | Land Purchase Price. This field is not displayed or used if land is leased. | 0 | [0 – 100000000] |
| Property Tax Rate (%) | Property Tax Rate. This field is not displayed or used if land is leased. | 0 | [0 – 10] |
| Annual Land Lease Cost ($/acre/year) | Annual Lease Rate. This field is not displayed or used if land is purchased. | 500 | >= 0 |
| Annual Land Lease Escalation Rate (%) | Land Lease Escalation Rate. This field is not displayed or used if land is purchased. | 0 | [-100 – 100] |
| Design, Engineering, Permitting Costs ($/kWac) | Design & Engineering Costs | 50 | >= 0 |
| Contractor Management and Margins (%) | Profit margin on construction labor and equipment supplied by contractor | 15 | [0 – 100] |
| Other Development Costs (AC) ($/kWac) | Development costs not accounted for otherwise, proportional to AC system size | 0 | >= 0 |
| Other Development Costs (Area) ($/acre) | Development costs not accounted for otherwise, proportional to developed area of plant | 0 | >= 0 |
| Other Development Costs (DC) ($/kWdc) | Development costs not accounted for otherwise, proportional to DC system size | 0 | >= 0 |
| Other Development Costs (Fixed) ($) | Development costs not accounted for otherwise, fixed | 0 | >= 0 |
| Average material Shipping Cost (%) | Shipping cost as a percent of the total BOM. | 4 | [0 – 100] |
Step 6: Enter Construction Costs.
| Field | Description | Default | Range |
| Construction Labor Rate ($/hr) | Construction Labor Rate | 60 | [0 – 100] |
| Electrical Labor Rate ($/hr) | Electrical Labor Rate | 75 | [0 – 100] |
| Civil Works Excluding Road Installation (man-min/kW DC) | Man Minutes for Civil work per kW. | 30 | >= 0 |
| Mobilization and Staging (man-min/kW DC) | Man Minutes for Mobilization and Staging per kW. | 10 | >= 0 |
| Panel Install (man-min/kW DC) | Man Minutes per kW for Panel Install Labor. | 27 | >= 0 |
| DC Electricals Install (man-min/kW DC) | Man Minutes per kW for DC Install Labor | 25 | >= 0 |
| AC Electricals Install (man-min/kW AC) | Man Minutes per kW for AC Electrical and Inverter Installation | 13 | >= 0 |
| Trenchwork (man-min/ft) | Man Minutes per foot of Cable Trenching Installation | 4 | >= 0 |
| Road Install (man-mins/ft) | Man Mins per Ft Road Install. This task duration is applied to all internal access roads automatically placed. | 10 | >= 0 |
| Fencing Install (man-mins/ft) | Man Minutes for Fencing Installation Labor per unit distance | 8 | [1 – 100] |
Step 7: Enter Loan Information.
| Field | Description | Default | Range |
| Loan Fraction (%) | Percent of the total installed cost that is financed with a loan. | 50 | [0 – 100] |
| Loan Term (years) | Number of years that it takes to pay off the loan. | 20 | [0 – 50] |
| Loan Rate (%/year) | Yearly interest rate on the loan. | 7 | [0 – 100] |
Step 8: Enter Operation Costs.
| Field | Description | Default | Range |
| O&M Costs ($/year/kWdc) | Annual Operation and Maintenance Costs | 15 | [0 – 50] |
| O&M Escalation (%/year) | Operation and Maintenance Cost increase per year | 0 | – |
Step 9: Enter Tax Information.
| Field | Description | Default | Range |
| Federal Tax Rate (%) | Federal Income Tax Rate | 35 | [0 – 100] |
| State Tax Rate (%) | State Income Tax Rate | 7 | [0 – 100] |
| Sales Tax Rate (%) | Sales tax Rate | 5 | [0 – 100] |
Step 10: Enter Depreciation Information
| Field | Description | Default | Range |
| Federal Depreciation Type | Federal Depreciation Type | 5 Year Half-Year MACRS | [None, 5 Year Half-Year MACRS, Straight Line] |
| State Depreciation Type | State Depreciation Type | 5 Year Half-Year MACRS | [None, 5 Year Half-Year MACRS, Straight Line] |
| Federal Depreciation Years | Federal Depreciation Straight Line Years. This field becomes active if Straight Line is selected for Federal Depreciation Type | 7 | [0 – 10] |
| State Depreciation Years | State Depreciation Straight Line Years. This field becomes active if Straight Line is selected for State Depreciation Type | 7 | [0 – 10] |
Step 11: Enter Incentive Information.
| Field | Description | Default | Range |
| Federal Investment Tax Credit (ITC) (%) | Investment tax credits reduce the project’s tax liability in year one of the project cash flow. The ITC amount is computed as a percent of the total installed cost of the project. The ITC is assumed to reduce both the federal and state depreciation basis. | 30 | [0 – 100] |
| State Investment Tax Credit (ITC) (%) | Investment tax credits reduce the project’s tax liability in year one of the project cash flow. The ITC amount is computed as a percent of the total installed cost of the project. The ITC is assumed to reduce both the federal and state depreciation basis. | 0 | [0 – 100] |
| Federal Production Based Incentive ($/kWh) | Production-based incentives reduce tax liability by providing additional energy revenue. These incentives do not affect the depreciation basis and are assumed to be taxable for both state and federal income taxes. They experience 0 escalation and apply to all years of energy production. | 0 | [0 – 100] |
| State Production Based Incentive ($/kWh) | Production-based incentives reduce tax liability by providing additional energy revenue. These incentives do not affect the depreciation basis and are assumed to be taxable for both state and federal income taxes. They experience 0 escalation and apply to all years of energy production. | 0 | [0 – 100] |
Step 12: Click Save. Data entered may be lost if not manually saved.